Trace and monitor crawlers
OpenTelemtery is a collection of APIs, SDKs, and tools to instrument, generate, collect, and export telemetry data (metrics, logs, and traces) to help you analyze your software’s performance and behavior. In the context of crawler development, it can be used to better understand how the crawler internally works, identify bottlenecks, debug, log metrics, and more. The topic described in this guide requires at least a basic understanding of OpenTelemetry. A good place to start is What is open telemetry.
In this guide, it will be shown how to set up OpenTelemetry and instrument a specific crawler to see traces of individual requests that are being processed by the crawler. OpenTelemetry on its own does not provide out of the box tool for convenient visualisation of the exported data (apart from printing to the console), but there are several good available tools to do that. In this guide, we will use Jaeger to visualise the telemetry data. To better understand concepts such as exporter, collector, and visualisation backend, please refer to the OpenTelemetry documentation.
Set up the Jaeger
This guide will show how to set up the environment locally to run the example code and visualize the telemetry data in Jaeger that will be running locally in a docker container.
To start the preconfigured Docker container, you can use the following command:
docker run -d --name jaeger -e COLLECTOR_OTLP_ENABLED=true -p 16686:16686 -p 4317:4317 -p 4318:4318 jaegertracing/all-in-one:latest
For more details about the Jaeger setup, see the getting started section in their documentation. You can see the Jaeger UI in your browser by navigating to http://localhost:16686
Instrument the Crawler
Now you can proceed with instrumenting the crawler to send the telemetry data to Jaeger and running it. To have the Python environment ready, you should install either crawlee[all] or crawlee[otel], This will ensure that OpenTelemetry dependencies are installed, and you can run the example code snippet.
In the following example, you can see the function instrument_crawler that contains the instrumentation setup and is called before the crawler is started. If you have already set up the Jaeger, then you can just run the following code snippet.
import asyncio

from opentelemetry.exporter.otlp.proto.grpc.trace_exporter import OTLPSpanExporter
from opentelemetry.sdk.resources import Resource
from opentelemetry.sdk.trace import TracerProvider
from opentelemetry.sdk.trace.export import SimpleSpanProcessor
from opentelemetry.trace import set_tracer_provider

from crawlee.crawlers import BasicCrawlingContext, ParselCrawler, ParselCrawlingContext
from crawlee.otel import CrawlerInstrumentor
from crawlee.storages import Dataset, KeyValueStore, RequestQueue


def instrument_crawler() -> None:
    """Add instrumentation to the crawler."""
    resource = Resource.create(
        {
            'service.name': 'ExampleCrawler',
            'service.version': '1.0.0',
            'environment': 'development',
        }
    )

    # Set up the OpenTelemetry tracer provider and exporter
    provider = TracerProvider(resource=resource)
    otlp_exporter = OTLPSpanExporter(endpoint='localhost:4317', insecure=True)
    provider.add_span_processor(SimpleSpanProcessor(otlp_exporter))
    set_tracer_provider(provider)
    # Instrument the crawler with OpenTelemetry
    CrawlerInstrumentor(
        instrument_classes=[RequestQueue, KeyValueStore, Dataset]
    ).instrument()


async def main() -> None:
    """Run the crawler."""
    instrument_crawler()

    crawler = ParselCrawler(max_requests_per_crawl=100)
    kvs = await KeyValueStore.open()

    @crawler.pre_navigation_hook
    async def pre_nav_hook(_: BasicCrawlingContext) -> None:
        # Simulate some pre-navigation processing
        await asyncio.sleep(0.01)

    @crawler.router.default_handler
    async def handler(context: ParselCrawlingContext) -> None:
        await context.push_data({'url': context.request.url})
        await kvs.set_value(key='url', value=context.request.url)
        await context.enqueue_links()

    await crawler.run(['https://crawlee.dev/'])


if __name__ == '__main__':
    asyncio.run(main())
Analyze the results
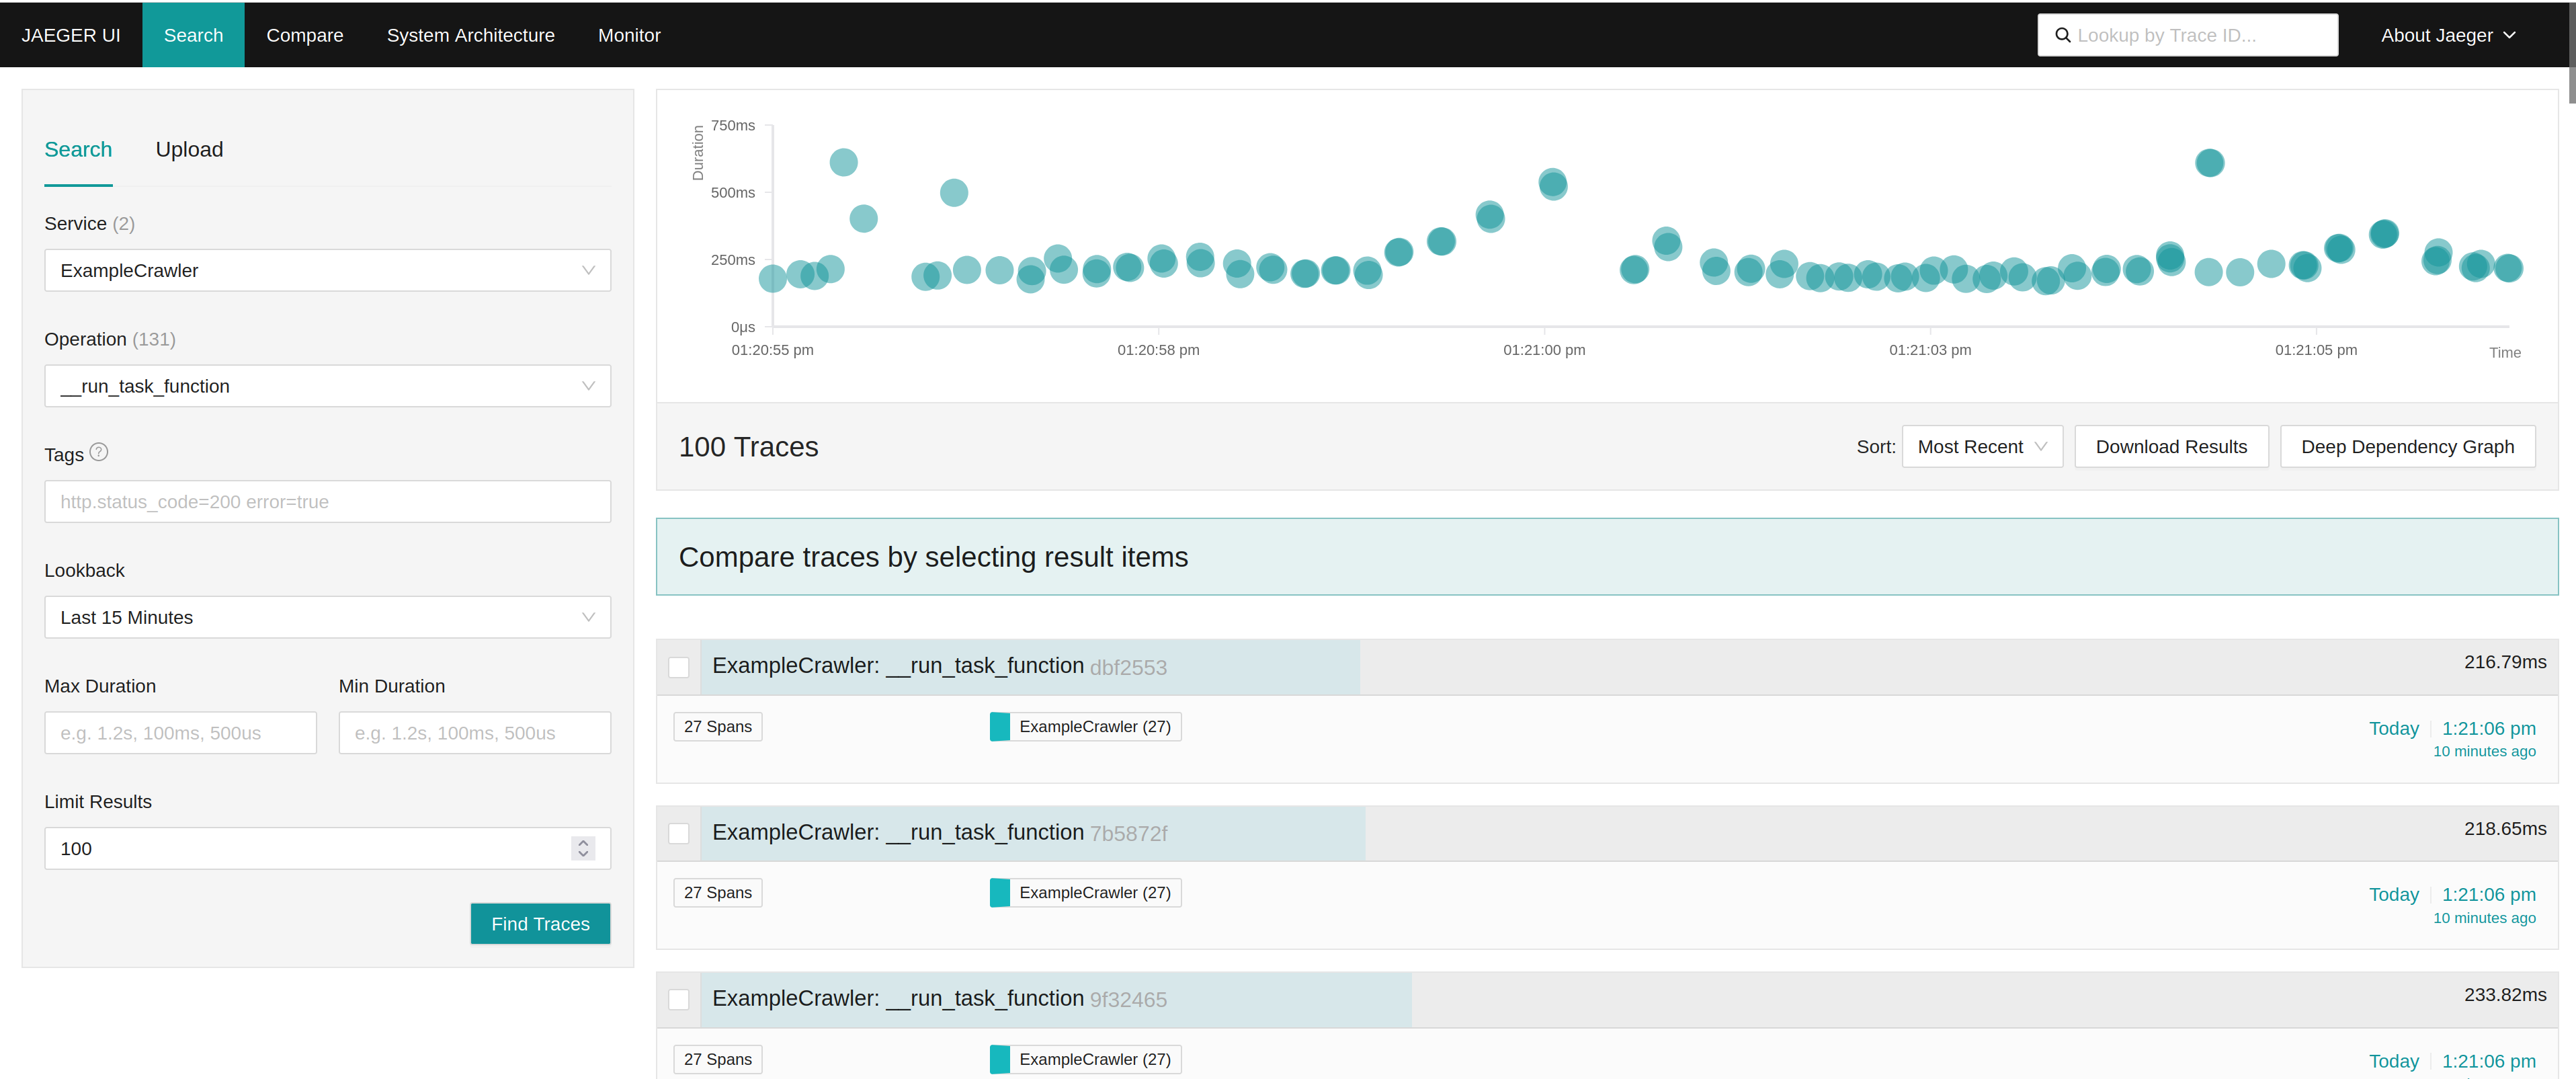
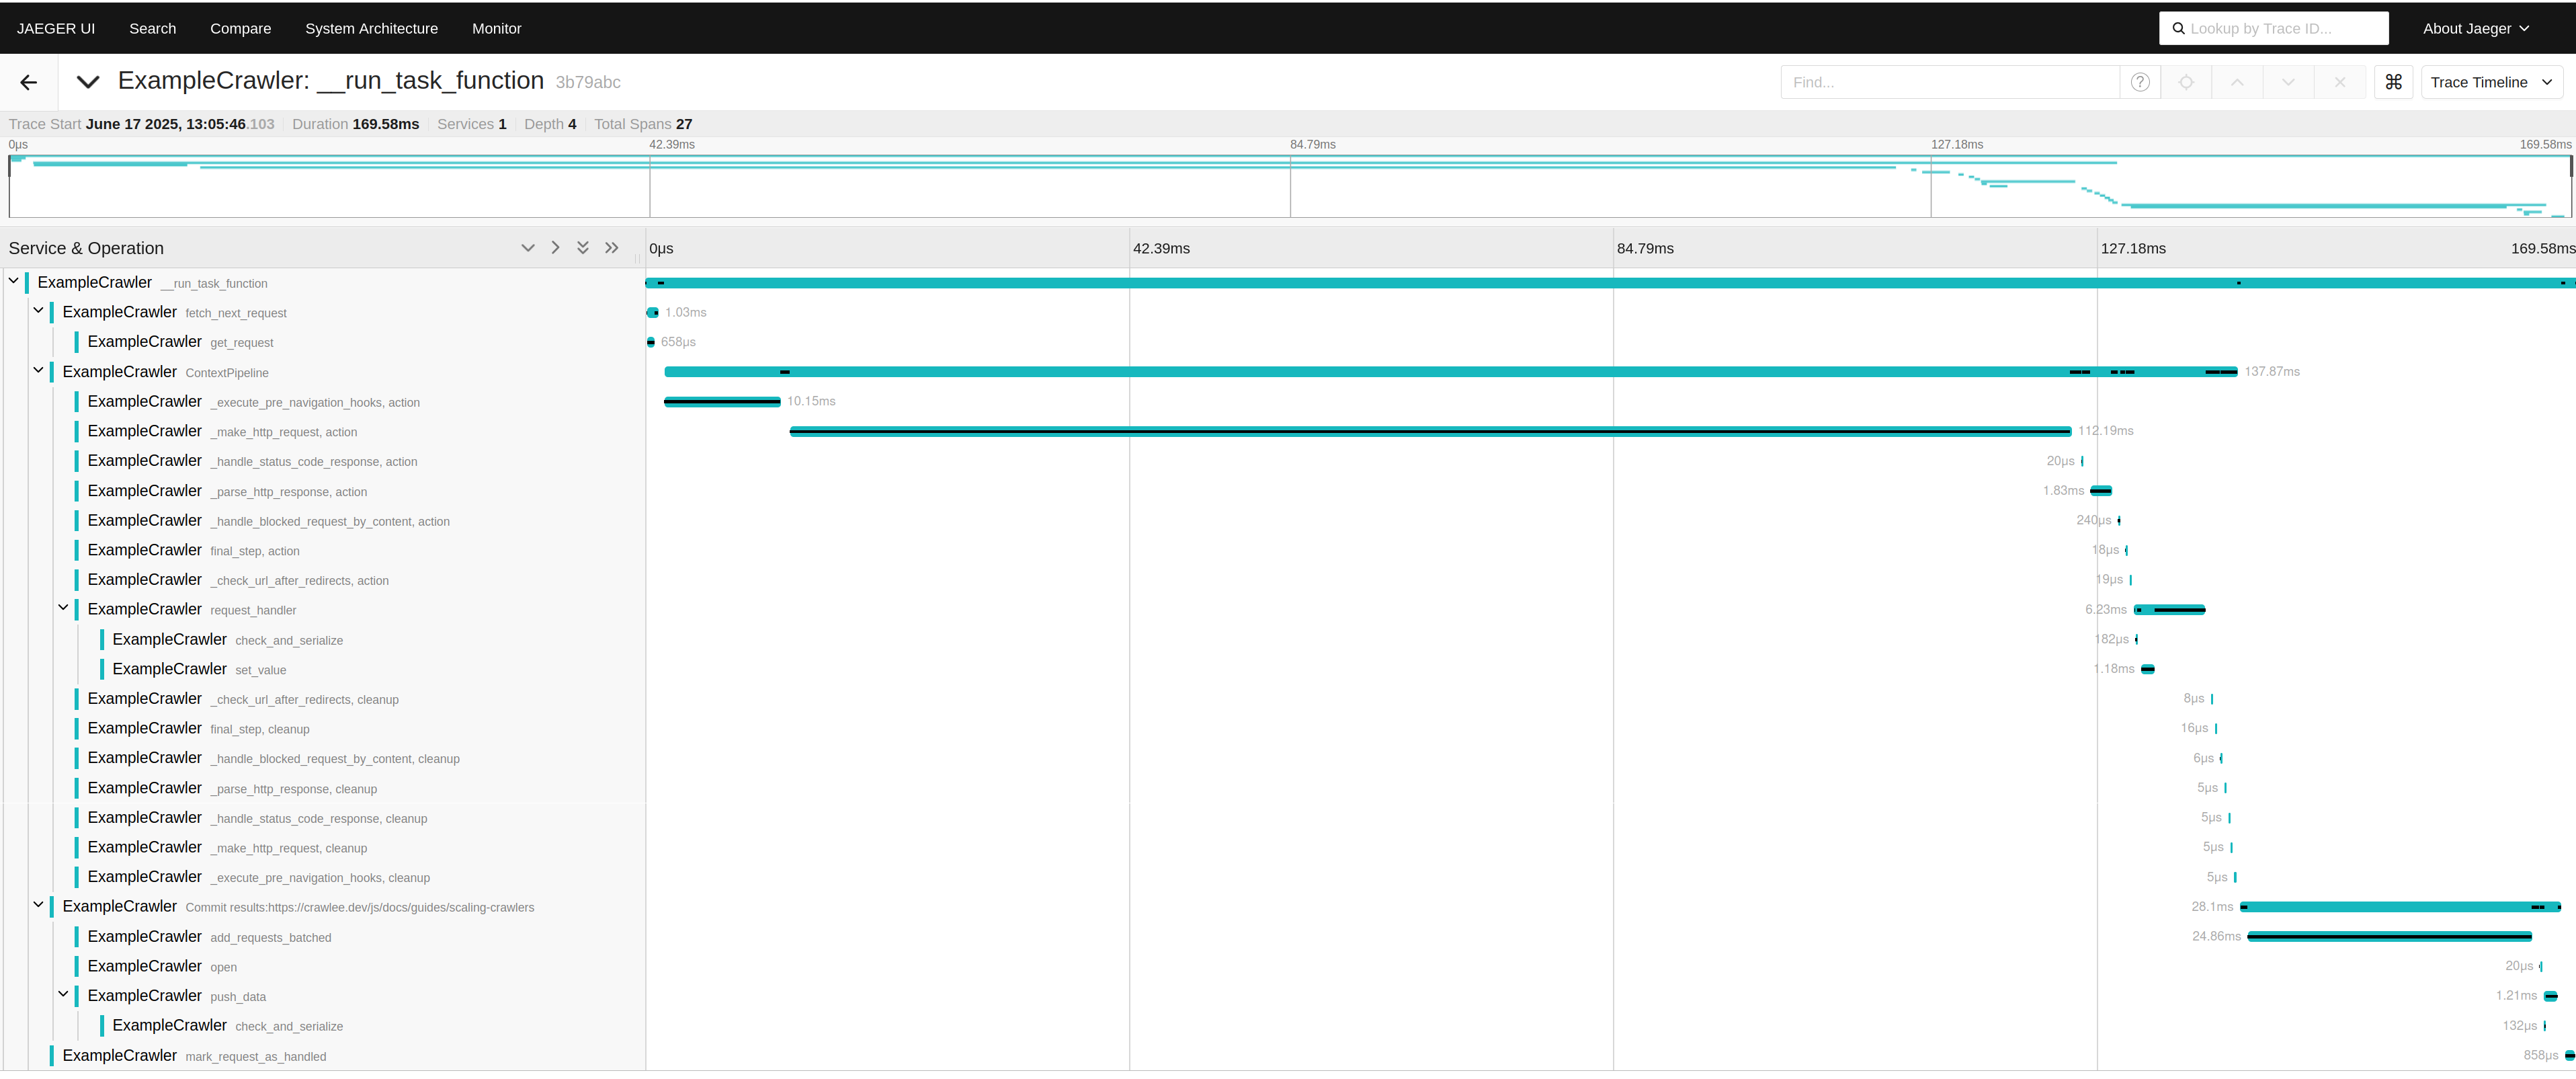
In the Jaeger UI, you can search for different traces, apply filtering, compare traces, view their detailed attributes, view timing details, and more. For the detailed description of the tool's capabilities, please refer to the Jaeger documentation.


You can use different tools to consume the OpenTelemetry data that might better suit your needs. Please see the list of known Vendors in OpenTelemetry documentation.
Customize the instrumentation
You can customize the CrawlerInstrumentor. Depending on the arguments used during its initialization, the instrumentation will be applied to different parts of the Crawlee code. By default, it instruments some functions that can give quite a good picture of each individual request handling. To turn this default instrumentation off, you can pass request_handling_instrumentation=False during initialization. You can also extend instrumentation by passing instrument_classes=[...] initialization argument that contains classes you want to be auto-instrumented. All their public methods will be automatically instrumented. Bear in mind that instrumentation has some runtime costs as well. The more instrumentation is used, the more overhead it will add to the crawler execution.
You can also create your instrumentation by selecting only the methods you want to instrument. For more details, see the CrawlerInstrumentor source code and the Python documentation for OpenTelemetry.
If you have questions or need assistance, feel free to reach out on our GitHub or join our Discord community.