Trace and monitor crawlers
OpenTelemetry is a collection of APIs, SDKs, and tools to instrument, generate, collect, and export telemetry data (metrics, logs, and traces) to help you analyze your software's performance and behavior. You can learn more about its basic concepts in the OpenTelemetry documentation.
In this guide, we'll show you how to set up OpenTelemetry and instrument your Crawlee crawlers to see traces of individual requests as they are processed. OpenTelemetry on its own does not provide visualization tools, so we'll use Jaeger as our tracing backend. Feel free to use any other OpenTelemetry-compatible backend. Check the OpenTelemetry vendors list for more options.
Set up Jaeger
This guide will show you how to set up the environment locally to run the example code and visualize the telemetry data in Jaeger running in a Docker container.
To start the preconfigured Docker container, create a docker-compose.yml file:
services:
  jaeger:
    image: jaegertracing/all-in-one:1.53
    container_name: jaeger
    ports:
      # Jaeger UI
      - "16686:16686"
      # OTLP gRPC
      - "4317:4317"
      # OTLP HTTP
      - "4318:4318"
    environment:
      - COLLECTOR_OTLP_ENABLED=true
    restart: unless-stopped
Then start it with:
docker compose up -d
For more details about the Jaeger setup, see the getting started section in their documentation. You can see the Jaeger UI in your browser by navigating to http://localhost:16686.
Install dependencies
To instrument your Crawlee crawler, you need to install the @crawlee/otel package along with the OpenTelemetry SDK packages:
npm install @crawlee/otel @opentelemetry/api @opentelemetry/api-logs @opentelemetry/sdk-node @opentelemetry/sdk-trace-base @opentelemetry/resources @opentelemetry/semantic-conventions @opentelemetry/exporter-trace-otlp-grpc
Instrument the crawler
OpenTelemetry instrumentation must be set up before importing Crawlee or any other instrumented modules. The easiest way to do this is to create a separate setup file and import it first using Node.js's --import flag.
Module hook
Crawlee is published as ECMAScript modules, so the automatic instrumentation can only patch the crawler classes through Node's module hook. Register it in its own file, which is preloaded ahead of everything else:
import { register } from 'node:module';
import { pathToFileURL } from 'node:url';

// Installs the OpenTelemetry module hook, which the automatic instrumentation needs in order to patch the Crawlee
// classes as they are imported. This file must be preloaded before the OpenTelemetry setup and before the crawler.
register('@opentelemetry/instrumentation/hook.mjs', pathToFileURL('./'));
Setup file
Create a setup file that initializes OpenTelemetry with the Crawlee instrumentation. Because the exporters buffer data, the setup file is also where the SDK is shut down, so that everything is flushed before the process exits:
import { CrawleeInstrumentation } from '@crawlee/otel';
import { OTLPTraceExporter } from '@opentelemetry/exporter-trace-otlp-grpc';
import { resourceFromAttributes } from '@opentelemetry/resources';
import { NodeSDK } from '@opentelemetry/sdk-node';
import { BatchSpanProcessor } from '@opentelemetry/sdk-trace-base';
import { ATTR_SERVICE_NAME, ATTR_SERVICE_VERSION } from '@opentelemetry/semantic-conventions';

// Create a resource that identifies your service
const resource = resourceFromAttributes({
    [ATTR_SERVICE_NAME]: 'my-crawler',
    [ATTR_SERVICE_VERSION]: '1.0.0',
    'deployment.environment': 'development',
});

// Configure exporters to send data to Jaeger via OTLP
// The gRPC exporter takes the collector endpoint without a signal path - unlike the HTTP one,
// which would use `http://localhost:4318/v1/traces`.
const traceExporter = new OTLPTraceExporter({
    url: 'http://localhost:4317',
});

// Create the Crawlee instrumentation
const crawleeInstrumentation = new CrawleeInstrumentation();

// Initialize the OpenTelemetry SDK
export const sdk = new NodeSDK({
    resource,
    spanProcessors: [new BatchSpanProcessor(traceExporter)],
    instrumentations: [crawleeInstrumentation],
});

// Start the SDK
sdk.start();

console.log('OpenTelemetry initialized');

// This file is preloaded before the crawler, so it also owns flushing the buffered telemetry on the way out.
let shuttingDown: Promise<void> | undefined;

const shutdown = () => {
    // Every handler below can fire, and the SDK must only be shut down once.
    shuttingDown ??= sdk.shutdown();
    return shuttingDown;
};

// `beforeExit` covers a script that simply runs to completion. The flush it starts is async work, so Node keeps the
// process alive for it and then fires `beforeExit` once more - hence `on` rather than `once`, and hence `shutdown`
// having to be idempotent.
process.on('beforeExit', () => {
    void shutdown();
});

// Signals have to be handled separately, as they do not emit `beforeExit`. `SIGINT` is the one you send by pressing
// Ctrl-C, so without it a local run loses whatever the exporter had not sent yet.
for (const signal of ['SIGINT', 'SIGTERM'] as const) {
    process.once(signal, () => {
        void shutdown().then(() => process.exit(0));
    });
}
Main crawler file
Now create your crawler. The CrawleeInstrumentation will automatically instrument the core crawler methods:
import { CheerioCrawler } from 'crawlee';

const crawler = new CheerioCrawler({
    maxRequestsPerCrawl: 10,

    async requestHandler({ request, $, enqueueLinks, log }) {
        const title = $('title').text();
        log.info(`Crawled ${request.url}`, { title });

        await enqueueLinks({
            include: ['https://crawlee.dev/**'],
        });
    },
});

await crawler.run(['https://crawlee.dev']);

// The setup file flushes the telemetry on exit.
console.log('Crawl complete. View traces at http://localhost:16686');
Run the crawler
Run your crawler with the setup file imported first:
npx tsx --import ./src/register-hook.ts --import ./src/setup.ts ./src/main.ts
The --import flags run in order, before any of your own code: the hook is installed first, then the OpenTelemetry SDK
starts, and only then is the crawler loaded and patched.
The examples on this page live in the Crawlee repository, so to run this one from a checkout, from the repository root:
pnpm exec tsx --import ./docs/guides/trace-and-monitor-register-hook.ts \
    --import ./docs/guides/trace-and-monitor-setup.ts \
    ./docs/guides/trace-and-monitor-basic.ts
Troubleshoot instrumentation setup
Proper setup of instrumentation depends on your specific environment setup. Please refer to the OTEL documentation.
Analyze the results
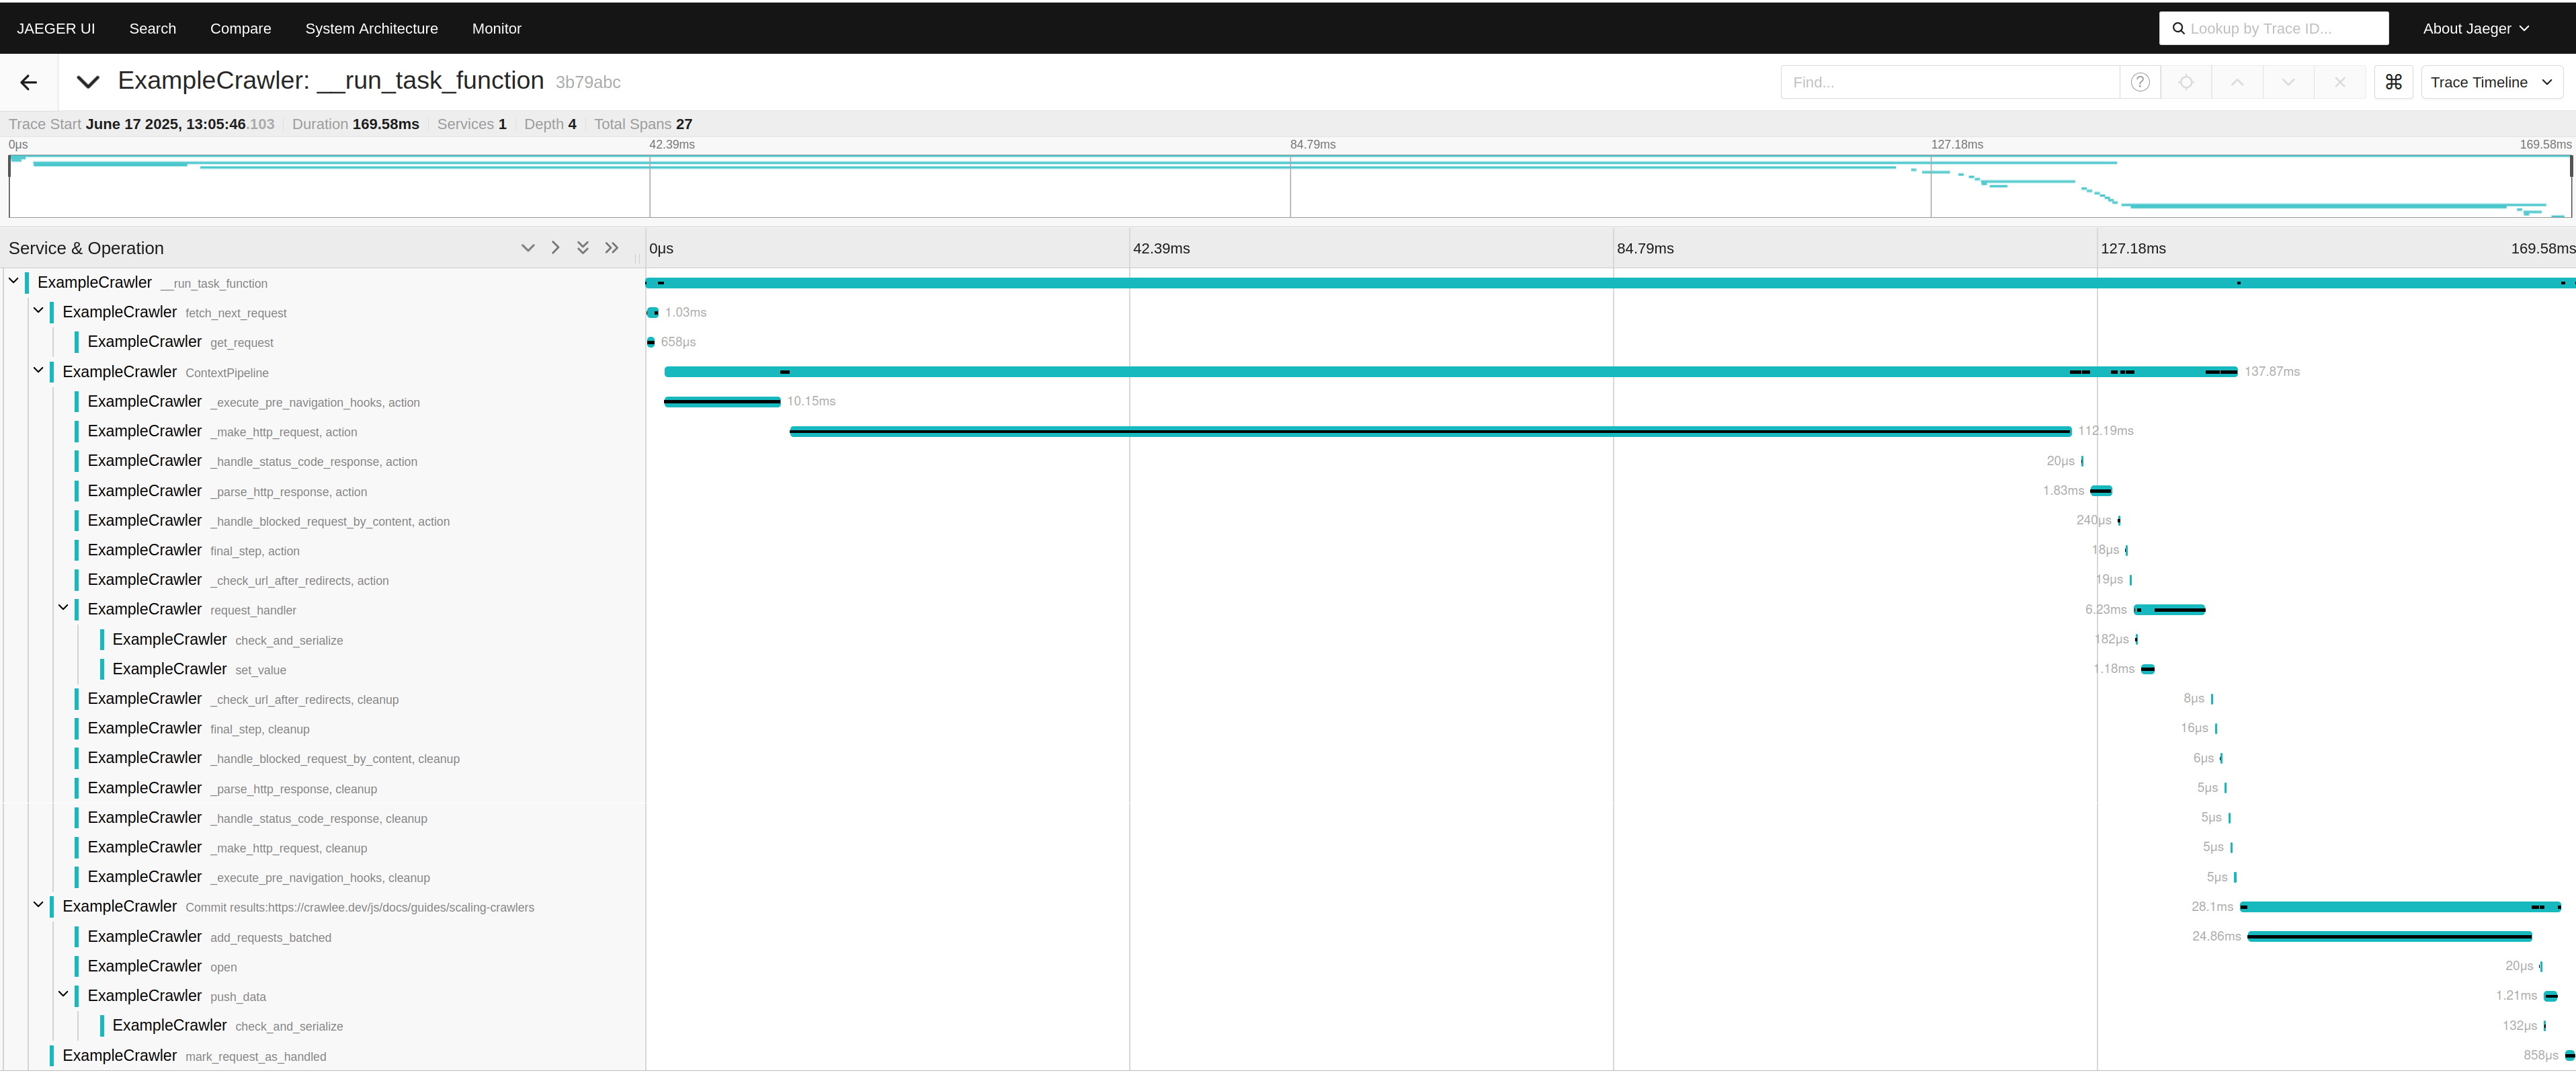
In the Jaeger UI, you can search for different traces, apply filtering, compare traces, view their detailed attributes, view timing details, and more. For a detailed description of the tool's capabilities, please refer to the Jaeger documentation.
Customize the instrumentation
The CrawleeInstrumentation class provides several configuration options to customize what gets instrumented:
| Option | Default | Description |
|---|---|---|
enabled | true | Enable or disable the instrumentation entirely |
requestHandlingInstrumentation | true | Instrument the core request handling methods of the crawlers |
logInstrumentation | true | Forward Crawlee logs to OpenTelemetry logs |
customInstrumentation | [] | Array of custom class methods to instrument |
Configuration example
import { CrawleeInstrumentation } from '@crawlee/otel';

const crawleeInstrumentation = new CrawleeInstrumentation({
    // Disable automatic request handling instrumentation
    requestHandlingInstrumentation: false,
    // Disable log forwarding
    logInstrumentation: false,
    // Add custom instrumentation
    customInstrumentation: [
        {
            moduleName: '@crawlee/basic',
            className: 'BasicCrawler',
            methodName: 'run',
            spanName: 'my-custom-span-name',
        },
    ],
});
Manual span instrumentation with wrapWithSpan
For more fine-grained control, you can use the wrapWithSpan utility to wrap specific functions with OpenTelemetry spans. This is particularly useful for instrumenting request handlers, hooks, and error handlers.
import { wrapWithSpan } from '@crawlee/otel';
import { context, trace } from '@opentelemetry/api';
import { ATTR_EXCEPTION_MESSAGE, ATTR_HTTP_REQUEST_METHOD, ATTR_URL_FULL } from '@opentelemetry/semantic-conventions';
import type { CheerioCrawlingContext, CrawlingContext } from 'crawlee';
import { CheerioCrawler } from 'crawlee';

const crawler = new CheerioCrawler({
    maxRequestsPerCrawl: 10,

    // Wrap the request handler with a custom span
    requestHandler: wrapWithSpan(
        async ({ request, $, enqueueLinks, log }: CheerioCrawlingContext) => {
            // Access the current span to add custom attributes
            const span = trace.getSpan(context.active());

            const title = $('title').text();
            const headings = $('h1, h2').length;
            const links = $('a').length;

            if (span) {
                span.setAttribute('page.title', title);
                span.setAttribute('page.headings_count', headings);
                span.setAttribute('page.links_count', links);
            }

            log.info(`Scraped page`, { url: request.url, title });

            await enqueueLinks({
                include: ['https://crawlee.dev/**'],
            });
        },
        {
            // Dynamic span name based on the request
            spanName: ({ request }: CheerioCrawlingContext) => `scrape ${request.url}`,
            // Add attributes to the span
            spanOptions: ({ request }: CheerioCrawlingContext) => ({
                attributes: {
                    [ATTR_URL_FULL]: request.url,
                    [ATTR_HTTP_REQUEST_METHOD]: request.method,
                },
            }),
        },
    ),

    // Wrap hooks with spans
    preNavigationHooks: [
        wrapWithSpan(
            ({ log }: CheerioCrawlingContext) => {
                log.debug('Pre-navigation hook executed');
            },
            {
                spanName: 'pre-navigation-hook',
            },
        ),
    ],

    // Wrap error handlers
    errorHandler: wrapWithSpan(
        ({ request, log }: CrawlingContext, error: Error) => {
            log.error(`Request failed: ${request.url}`, {
                error: error.message,
            });
        },
        {
            spanName: ({ request }: CrawlingContext) => `error-handler ${request.url}`,
            spanOptions: ({ request }: CrawlingContext, error: Error) => ({
                attributes: {
                    [ATTR_URL_FULL]: request.url,
                    [ATTR_EXCEPTION_MESSAGE]: error.message,
                },
            }),
        },
    ),

    failedRequestHandler: wrapWithSpan(
        ({ request, log }: CrawlingContext, error: Error) => {
            log.error(`Request permanently failed: ${request.url}`, {
                error: error.message,
            });
        },
        {
            spanName: 'failed-request-handler',
        },
    ),
});

await crawler.run(['https://crawlee.dev']);
wrapWithSpan options
The wrapWithSpan function accepts these options:
| Option | Type | Description |
|---|---|---|
spanName | string | ((...args) => string) | Static name or function that receives the handler arguments and returns a span name |
spanOptions | SpanOptions | ((...args) => SpanOptions) | Static options or function that returns OpenTelemetry SpanOptions including attributes |
tracer | Tracer | Custom tracer instance. Defaults to the tracer of the registered CrawleeInstrumentation, or to a tracer from the global provider when no instrumentation is registered. |
Accessing the current span
Inside a wrapped function, you can access the current span to add additional attributes or events:
import { context, trace } from '@opentelemetry/api';

requestHandler: wrapWithSpan(
    async ({ request, $ }) => {
        const span = trace.getSpan(context.active());

        const title = $('title').text();

        if (span) {
            span.setAttribute('page.title', title);
            span.addEvent('page_scraped', { url: request.url });
        }

        // ... rest of your handler
    },
    { spanName: 'request-handler' }
),
Custom class instrumentation
You can also create your instrumentation by selecting only the methods you want to instrument. Here's an example of adding custom instrumentation for specific crawler methods:
import { CrawleeInstrumentation } from '@crawlee/otel';
import { OTLPTraceExporter } from '@opentelemetry/exporter-trace-otlp-grpc';
import { resourceFromAttributes } from '@opentelemetry/resources';
import { NodeSDK } from '@opentelemetry/sdk-node';
import { BatchSpanProcessor } from '@opentelemetry/sdk-trace-base';
import { ATTR_HTTP_REQUEST_METHOD, ATTR_SERVICE_NAME, ATTR_URL_FULL } from '@opentelemetry/semantic-conventions';

const crawleeInstrumentation = new CrawleeInstrumentation({
    // Disable default request handling instrumentation
    requestHandlingInstrumentation: false,
    // Disable log forwarding to OpenTelemetry
    logInstrumentation: false,
    // Define custom methods to instrument
    customInstrumentation: [
        {
            moduleName: '@crawlee/basic',
            className: 'BasicCrawler',
            methodName: 'run',
            spanName: 'crawler.run',
            spanOptions() {
                return {
                    attributes: {
                        'crawler.type': this.constructor.name,
                    },
                };
            },
        },
        {
            moduleName: '@crawlee/basic',
            className: 'BasicCrawler',
            methodName: 'runRequestHandler',
            // Dynamic span name using the context argument
            spanName(context: any) {
                return `request ${context.request.url}`;
            },
            spanOptions(context: any) {
                return {
                    attributes: {
                        [ATTR_URL_FULL]: context.request.url,
                        [ATTR_HTTP_REQUEST_METHOD]: context.request.method,
                    },
                };
            },
        },
    ],
});

const resource = resourceFromAttributes({
    [ATTR_SERVICE_NAME]: 'custom-instrumented-crawler',
});

const traceExporter = new OTLPTraceExporter({
    url: 'http://localhost:4317',
});

export const sdk = new NodeSDK({
    resource,
    spanProcessors: [new BatchSpanProcessor(traceExporter)],
    instrumentations: [crawleeInstrumentation],
});

sdk.start();

// Like the setup file above, this one is preloaded before the crawler, so it also owns flushing the buffered
// telemetry on the way out - without this the batched spans are dropped when the process exits.
const shutdown = async () => {
    await sdk.shutdown();
};

// `beforeExit` covers a script that simply runs to completion...
process.once('beforeExit', () => {
    void shutdown();
});

// ...while signals have to be handled separately, as they do not emit `beforeExit`.
process.once('SIGTERM', () => {
    void shutdown().then(() => process.exit(0));
});
What gets instrumented automatically
When requestHandlingInstrumentation is enabled (the default), the following methods are automatically instrumented:
| Crawler | Method | Span Name |
|---|---|---|
BasicCrawler | run | crawlee.crawler.run |
BasicCrawler | handleRequest | crawlee.crawler.handleRequest |
BasicCrawler | runRequestHandler | crawlee.crawler.runRequestHandler |
BasicCrawler | requestFunctionErrorHandler | crawlee.crawler.requestFunctionErrorHandler |
BasicCrawler | handleFailedRequestHandler | crawlee.crawler.handleFailedRequestHandler |
HttpCrawler | makeHttpRequest | crawlee.http.makeHttpRequest |
BrowserCrawler | navigate | crawlee.browser.navigate |
AdaptivePlaywrightCrawler | runRequestHandler | crawlee.crawler.runRequestHandler |
crawlee.http.makeHttpRequest and crawlee.browser.navigate are recorded as client spans, since they are the calls
that leave your process. The rest are internal spans.
Every crawler inherits the BasicCrawler methods, so the table covers all of them. AdaptivePlaywrightCrawler is
listed separately only because it replaces runRequestHandler with its own implementation, which is instrumented in
its place - a run of it still produces one crawlee.crawler.runRequestHandler span per request.
Every automatically instrumented span carries the code.function.name attribute - spans you create yourself with
wrapWithSpan carry only the attributes you give them. The crawlee.crawler.run span additionally carries
crawlee.crawler.type with the class name of the crawler that is running, and spans of the methods that receive a
crawling context (the request handlers, navigation handlers and error handlers) also include:
url.full- the request URLhttp.request.method- the request methodcrawlee.request.id- the Crawlee request IDcrawlee.request.retry_count- how many times the request has been retried
url.full and http.request.method are the stable OpenTelemetry semantic conventions,
so traces stay comparable with the rest of your instrumented stack. Crawlee-specific data that has no semantic
convention keeps the crawlee. prefix.
Forwarded logs
With logInstrumentation enabled (the default), Crawlee logs are emitted as OpenTelemetry log records. The Crawlee log
level is mapped onto the OpenTelemetry severity (SOFT_FAIL and WARNING both become WARN, PERF becomes DEBUG),
the structured data of the log call becomes the log record attributes, and any Error in it is recorded as the
exception.type, exception.message and exception.stacktrace attributes.
This works for whichever logger you configure. The instrumentation patches the logging methods Crawlee derives in
BaseCrawleeLogger, so a Winston, Pino or hand-written adapter is forwarded just like the default one.
Crawlee leaves level filtering to the underlying logging library, so every message is forwarded regardless of the configured log level - filter them in your OpenTelemetry pipeline instead.
The record body is the message as it was passed to the log call, not the line the logger prints: a perf record has no
[PERF] prefix, and an exception record carries the message on its own with the error in the exception.*
attributes instead of appended to it. Match the two by attribute rather than by grepping for the printed line.
The records only go somewhere once you add a log record processor to the SDK, and the backend has to implement the
OTLP logs service. Jaeger is a tracing backend and does not - pointing a log exporter at the jaegertracing/all-in-one
container above makes every log batch fail with
UNIMPLEMENTED: unknown service opentelemetry.proto.collector.logs.v1.LogsService. Send the logs to an
OpenTelemetry Collector or a backend that ingests them instead.
To export the logs, install @opentelemetry/sdk-logs along with a log exporter and add a log record processor to the
setup file:
import { OTLPLogExporter } from '@opentelemetry/exporter-logs-otlp-grpc';
import { BatchLogRecordProcessor } from '@opentelemetry/sdk-logs';

export const sdk = new NodeSDK({
    // ... the trace configuration from above
    logRecordProcessors: [
        new BatchLogRecordProcessor({ exporter: new OTLPLogExporter({ url: 'http://localhost:4317' }) }),
    ],
});
Set logInstrumentation: false if you would rather keep the Crawlee logs out of OpenTelemetry entirely.